
IDE integration
Your IDE runs on your own machine, but the code runs in the project’s containers on the server. To bring the two together, every project has an IDE section with everything you need ready to copy: the SSH connection, interpreter paths, path mappings, debugger ports and JDBC URLs. This page explains what those values are for.
The SSH server
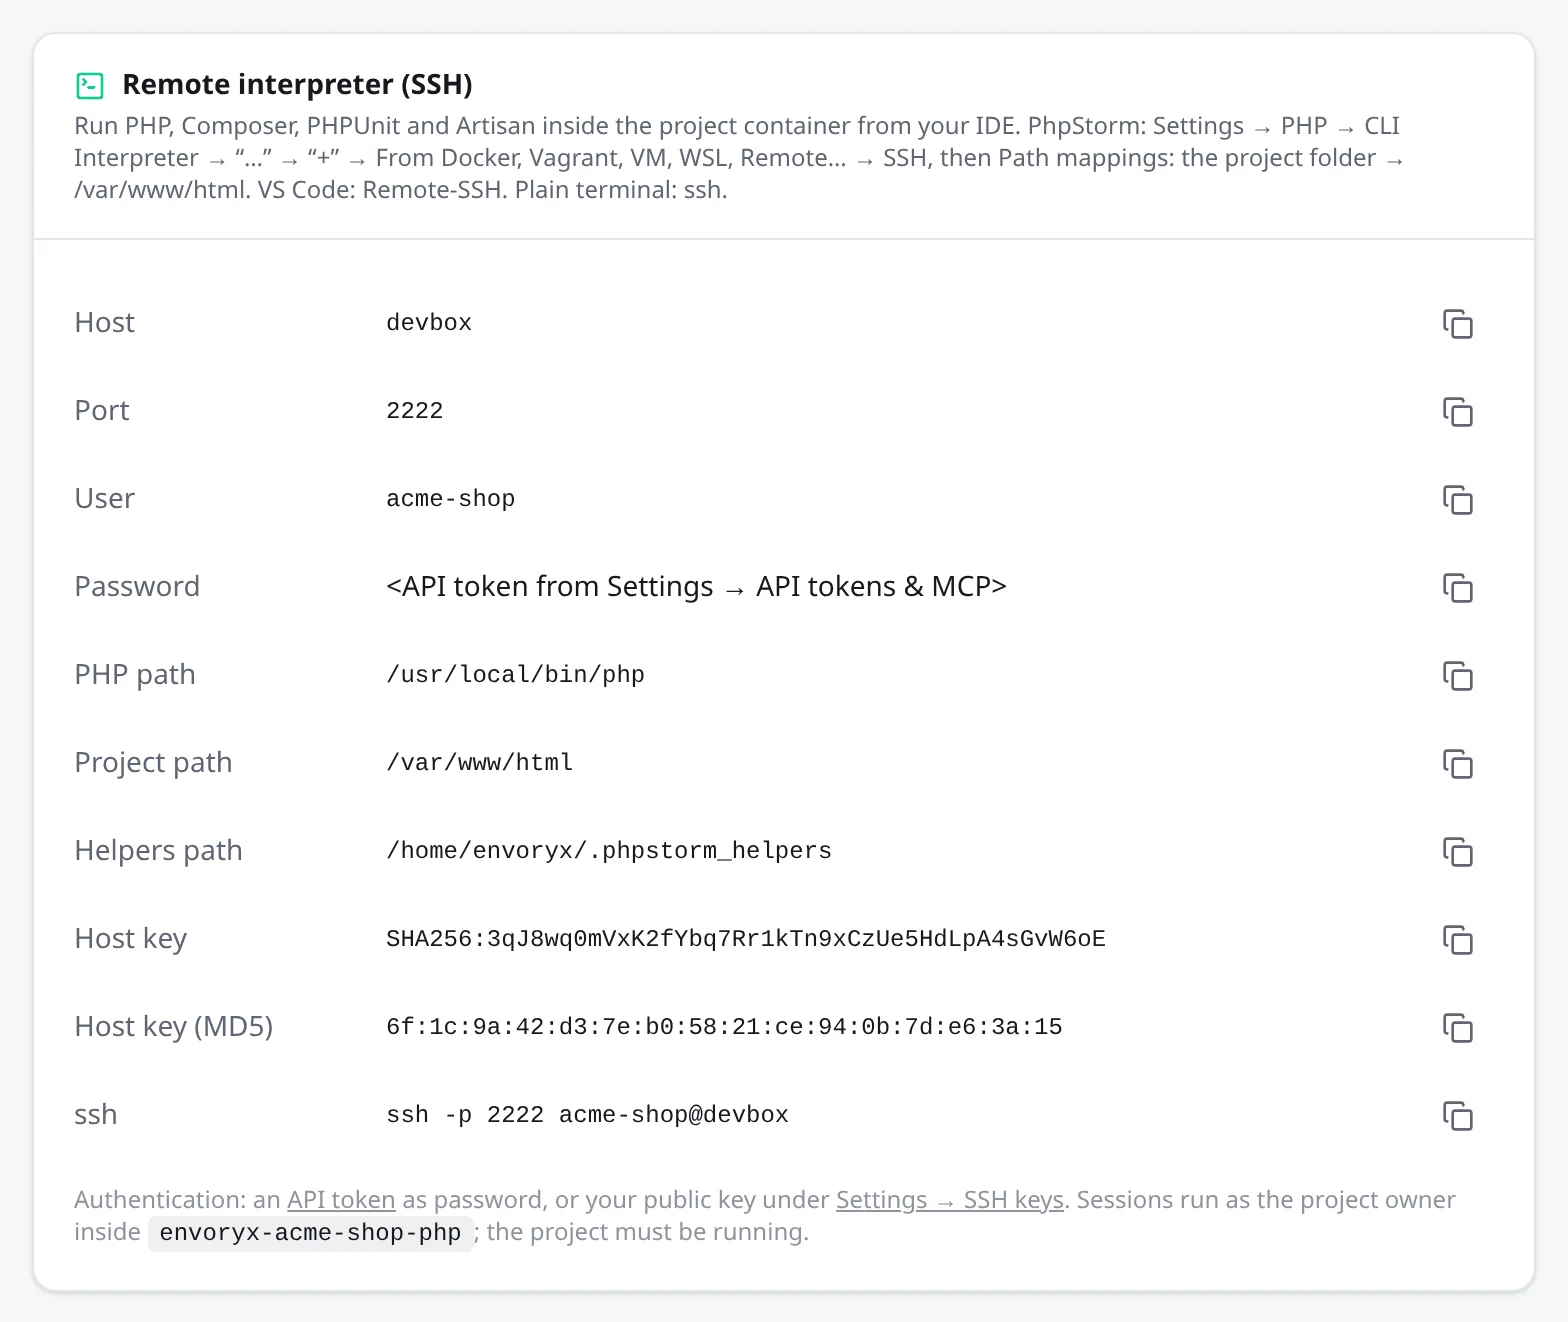
Section titled “The SSH server”Envoryx has its own SSH server on port 2222; publish that port, or use the container’s own IP. It’s the way into a project for remote interpreters, for SFTP and for your own terminal.
The user name is the project slug, shop for example. That lands you in the project’s application container: PHP if the project has PHP, otherwise Python, then Go, then Ruby, then Java, then .NET, then Node.js. If a project has several runtimes and you want a specific one, use shop.php, shop.python, shop.go, shop.ruby, shop.java, shop.dotnet or shop.node.
As a password you use an API token from Settings → API tokens & MCP, or you store your public key under Settings → SSH keys and skip passwords altogether. Every session is a docker exec into the container as the project owner. There’s no way through to a shell on the host itself. Over SFTP you see two folders: /var/www/html is the project, and /home/envoryx is a persistent home where tool caches and IDE helpers can live. An SFTP client starts in the project, like an ssh login. JetBrains IDEs start in the home instead, because they unpack their helpers (~/.phpstorm_helpers and friends) wherever they start, and those don’t belong in your repository.
Shells, interpreters and debuggers need the project running. Commands end up in the audit log, and too many wrong tokens lock an address out for five minutes; Locked out? explains what counts.
Remote interpreters
Section titled “Remote interpreters”With a remote interpreter your IDE runs tests, package managers and framework commands inside the container, with exactly the versions the project uses. Here’s where to set it up:
| IDE | Where | Values |
|---|---|---|
| PhpStorm | Settings → PHP → CLI Interpreter → … → From Docker, Vagrant, VM, WSL, Remote… → SSH | PHP /usr/local/bin/php, helpers /home/envoryx/.phpstorm_helpers, mapping project folder → /var/www/html |
| WebStorm | Settings → Languages & Frameworks → Node.js (in newer versions JavaScript Runtime) → Node interpreter → Add… → SSH | Node /usr/local/bin/node, project path /var/www/html |
| PyCharm | Settings → Project → Python Interpreter → Add Interpreter → On SSH… | interpreter /var/www/html/.venv/bin/python, project path /var/www/html |
| GoLand, RubyMine | the IDE’s SSH remote interpreter / SSH configuration | host, port and user from the IDE section (<slug>.go, <slug>.ruby), project path /var/www/html |
| IntelliJ IDEA, Rider | File → Remote Development → SSH (JetBrains Gateway, see below) | host, port and user from the IDE section; opens /var/www/html with the container’s JDK, Maven and Gradle or .NET SDK |
| VS Code | Remote-SSH: ssh -p 2222 shop@<host> |
open /var/www/html as the remote folder |
A static site has no application container, so there’s no shell and no remote interpreter for it. Its files are still there over SFTP, and the IDE section shows the SFTP values for that.
Debuggers
Section titled “Debuggers”Each runtime has its own debugger, and each is switched on in a slightly different place:
| Runtime | Debugger | How it is switched on | Default port |
|---|---|---|---|
| PHP | Xdebug | Runtime → PHP → Xdebug | 9003 (Xdebug connects to your IDE) |
| Node.js | Node inspector | Publish the Node.js inspector port on the Node service | 9229 |
| Python | debugpy | Publish the debugpy port; the application starts debugpy itself | 5678 |
| Go | Delve | Debug with Delve - the server runs under a headless Delve | 2345 |
| Ruby | rdbg (debug gem) | Debug with rdbg - the server runs under rdbg --open |
12345 |
| Java | JDWP | Debug with JDWP - the server’s JVM starts with the agent | 5005 |
| .NET | vsdbg (VS Code), Rider’s own | nothing to switch on for VS Code - it starts the debugger over SSH; Rider needs port forwarding (JetBrains Gateway) | none |
Xdebug works the other way round from the others: it connects back to your IDE. It runs in step-debugging mode (debug,develop, start_with_request=yes) and calls the machine that made the request. Behind the proxy that address comes from X-Forwarded-For; if that doesn’t work, it falls back to the developer machine you set in Settings → Domains & HTTPS → Project links & developer machine, and then to host.docker.internal. Map /var/www/html to your project folder in the IDE. PhpStorm finds its server through PHP_IDE_CONFIG=serverName=<project host>, which Envoryx sets in the PHP container, so name the server exactly like that; the php.xml in the IDE section also has the port the browser uses (443 behind the HTTPS proxy). Details on the PHP page. And switch Xdebug off again when you’re done, because it makes PHP noticeably slower.
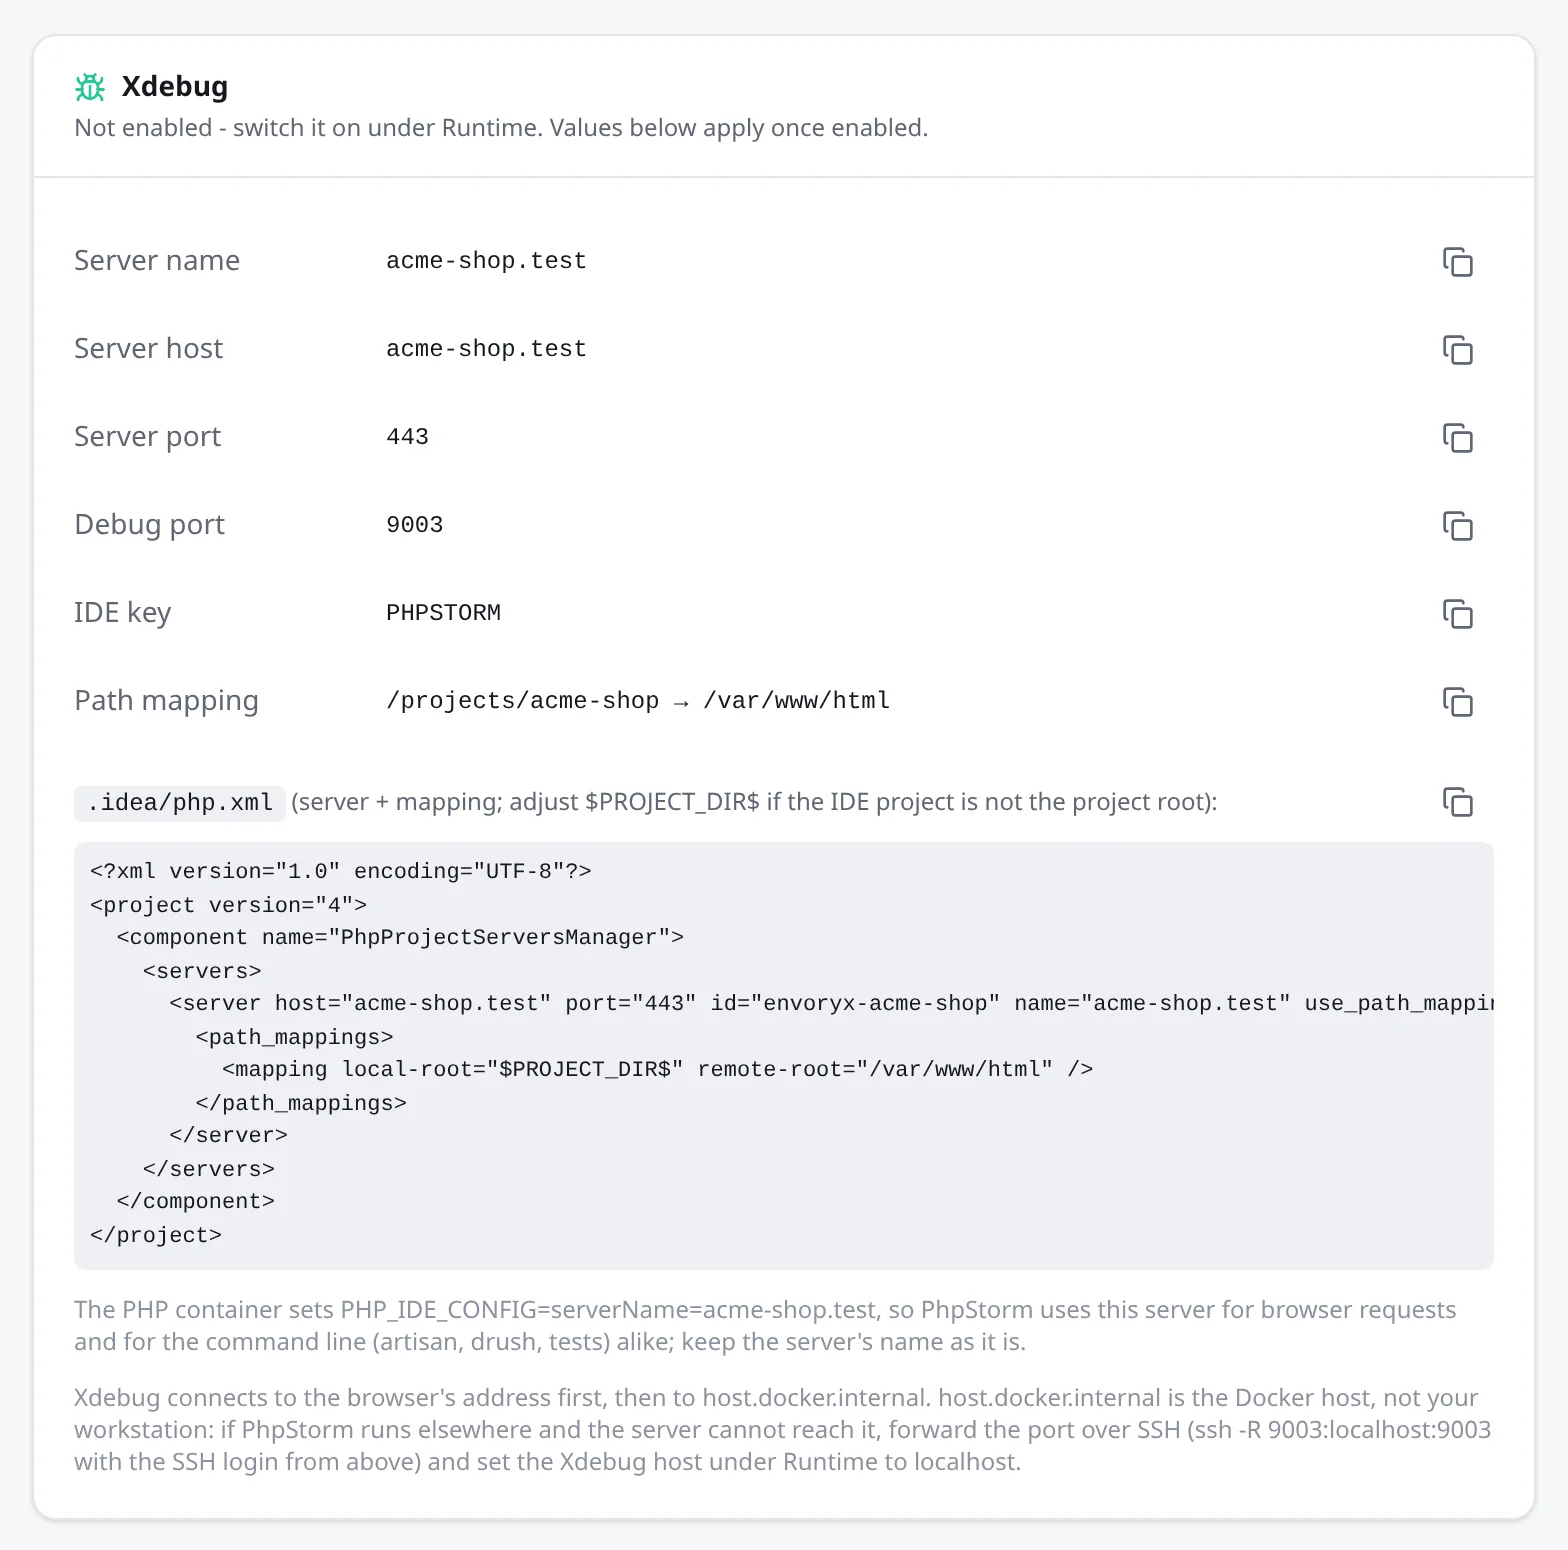
Debuggers that call your IDE (Xdebug, PyCharm’s Python Debug Server) need an address to call. Every runtime and worker container resolves host.docker.internal to the Docker host, so with the IDE on the Docker host that name just works. host.docker.internal isn’t your workstation, though. If the IDE runs on another machine that the server can’t reach, forward the port over SSH with the project’s SSH login (ssh -R 9003:localhost:9003 for Xdebug) and use localhost: for Xdebug that’s the Debugger host (optional) field in the PHP card, for PyCharm the host in its pydevd-pycharm snippet.
Delve: attach GoLand with Run → Edit Configurations → Go Remote, or VS Code with type: go, request: attach, mode: remote and a substitutePath from your folder to /var/www/html, using the host and port from the IDE section. When air rebuilds the server, it restarts Delve and the debug session ends; attach again and your breakpoints are hit as before. If the Go server isn’t switched on, only the port is published, and it waits for a dlv test --headless --listen=:2345 ./pkg/... you start in the terminal.
rdbg: in VS Code you attach with the VSCode rdbg Ruby Debugger extension (type: rdbg, request: attach, debugPort: "<host>:<port>", localfsMap: "/var/www/html:${workspaceFolder}"); from a terminal, rdbg -A <host> <port> does it. Without the Ruby server, the port waits for something like rdbg --open --host=0.0.0.0 --port=12345 -c -- bin/rails test started in the Ruby terminal.
JDWP: attach IntelliJ IDEA with Run → Remote JVM Debug, or VS Code with the Extension Pack for Java (type: java, request: attach, hostName, port), using the host and port from the IDE section. Without the Java server, the port waits for a JVM you start in the Java terminal with -agentlib:jdwp=transport=dt_socket,server=y,suspend=n,address=*:5005. Details on the Java page.
.NET: .NET needs no debug port. VS Code’s C# extension starts Microsoft’s vsdbg in the container through pipeTransport over SSH, after you’ve installed it once with Install vsdbg in the IDE section. Rider and Visual Studio use Attach to Remote Process over SSH; Rider needs Allow JetBrains Gateway for this project switched on, since its debugger uses SSH port forwarding. Because the pipe can’t answer a password prompt, store your public key under Settings → SSH keys first. A ready launch.json is on the .NET page. Once dotnet watch has applied a change by hot reload, no debugger can attach to that process anymore (error 0x80131c69), so restart the project or save a change hot reload can’t apply, then attach.
RubyMine is a special case. Its Ruby remote debug only speaks ruby-debug-ide, not the debug gem, so it can’t attach to rdbg. The way to go in RubyMine is to add the Ruby container as an SSH remote interpreter (user <slug>.ruby) and debug with RubyMine’s own debugger. You don’t need the rdbg switch for that, but Allow JetBrains Gateway for this project, because RubyMine’s debugger forwards a port over SSH.
JetBrains Gateway
Section titled “JetBrains Gateway”With Gateway the whole IDE backend runs on the server, and your machine only runs a thin client. That’s nice on a slow laptop, but it costs the server resources, so it’s off by default and you enable it per project: IDE → Allow JetBrains Gateway for this project turns on SSH port forwarding into the container. The IDE backend Gateway downloads (about 1.5 GB per IDE version) stays in the project’s home, so each project downloads its own. Where everyone is trusted, Settings → Package cache → Share the IDE backends between projects downloads it only once for all of them (/config/jetbrains/RemoteDev/dist); every project with Gateway can then change the shared backends, so a developer of one project could change the IDE another one runs. Index caches, local history and join links always stay in each project, so one project never sees another one’s source.
The backend runs as the project owner in the application container and wants 2-4 GB of RAM plus CPU while it indexes. Nothing runs until you actually connect, but on a small NAS I’d leave it off. Envoryx doesn’t ship any JetBrains software; Gateway itself is free, and whoever connects needs a valid subscription for the IDE.
To connect, choose SSH → New connection in Gateway, fill in the values from the IDE section, pick the IDE and use /var/www/html as the project directory. When you’re done, close the project in Gateway or click Stop IDE backend to free the memory. Changing the runtime recreates the container, which also ends the backend.
Opening a project over SFTP
Section titled “Opening a project over SFTP”You don’t need a network share to work on a project’s files. Open it as an SFTP deployment in PhpStorm and friends, or with VS Code Remote-SSH, using the same host, port and credentials as above and /var/www/html as the remote path.